Based on the SOA-C02 exam guideReport an error
SOA-C02· AssociateWeek 2 · Day 2~33 min read
Day 2 - CloudWatch Logs: The Internal Structure of Log Groups and Subscription Patterns
Logs are ultimately where operators start debugging an outage. If a metric tells you "one indicator is abnormal," a log tells you "exactly which exception occurred in which request." That is why CloudWatch Logs is the operator's No. 1 everyday tool. At the same time, CloudWatch Logs is also one of the services that most often blows up an operator's bill. If you don't set a retention policy and just let VPC Flow Logs flow in as is, a $10,000 bill arrives a month later.
Today we look deeply, from the operator's point of view, at the internal structure of Logs, the cost structure, retention, search, and subscription patterns, and even the choice of VPC Flow Logs destination.
The CloudWatch Logs Data Model
Log Group           ← Log container for the same application (unit of policy, KMS, retention)
   │
   ├─ Log Stream    ← Log sequence from a single source (EC2 instance, Lambda execution environment ID)
   │   │
   │   ├─ Log Event ← The actual log record (timestamp + message, up to 256KB)
   │   ├─ Log Event
   │   └─ Log Event
   │
   ├─ Log Stream
   └─ Log Stream
- Log Group: The unit of policy. Retention period, KMS encryption, metric filters, subscriptions, and IAM permissions are all at the Log Group level
- Log Stream: A chronological log sequence from a single source (instance ID, Lambda execution environment ID, ECS Task ID)
- Log Event: One line of log. timestamp (ms) + message (up to 256KB) + ingestionTime
Lambda has 1 Log Group per function (/aws/lambda/<funcName>) and 1 Stream per execution environment (container) instance. The CloudWatch Agent on EC2 usually separates Streams by instance ID. For ECS Fargate, creating streams by task ID, and for EKS by pod name, is the standard.
A Log Stream controls concurrency with a monotonically increasing token called the Sequence Token. If you called PutLogEvents concurrently on one Stream, one side failed with InvalidSequenceTokenException and had to retry with a new token. Since 2023, in the new mode (PutLogEvents v2), the sequence token became optional and concurrent writes became possible. However, if multiple sources write to one Stream, timestamp ordering can break, so the principle "one Stream = one source" is still the standard.
⚠️ Trap: The maximum log message size is 256KB. If a JSON object is too large, it is truncated or rejected. If an operator prints a large response body whole into the log, debugging information is lost to truncation. The standard pattern is to store large payloads in S3 and leave only the S3 key in the log.
Retention Policy: The Default Trap (Never Expire)
The default retention of a Log Group = "Never Expire" (kept forever). If the operator doesn't set it explicitly, cost increases without bound. This is one of the cost scenarios that appear in SOA-C02.
| Retention option | When to use |
|---|---|
| 1 day | Debug logs, high-volume access logs |
| 3 days | Short-lived debugging logs |
| 7–30 days | General application logs |
| 60–90 days | Security audit (90 days is usually recommended for CloudTrail) |
| 180 days–1 year | PCI-DSS (1 year), some financial regulations |
| 5–7 years | HIPAA (6 years), SOX (7 years) |
| 10 years | Some government and healthcare regulations |
| Never Expire | Almost never used (cost explosion) |
# Set the retention period in bulk — operator First-Day Action
aws logs put-retention-policy \
  --log-group-name /aws/lambda/my-function \
  --retention-in-days 14

# Change every Log Group with retention=None to 30 days in bulk
aws logs describe-log-groups --query 'logGroups[?retentionInDays==`null`].logGroupName' --output text \
  | xargs -I {} aws logs put-retention-policy --log-group-name {} --retention-in-days 30
As a hypothetical case, a company ran 500 Lambda functions for a year, and one day when they looked at the bill, CloudWatch Logs cost alone was $4,000 per month. The cause was that every function's Log Group was in the default "Never Expire" state. After changing everything to 7-day retention in bulk, cost dropped 90%. The No. 1 operator First Day Action is standardizing Log Group retention policies.
Three standard patterns for operators to automatically apply a retention policy to every new Log Group.
- EventBridge rule: Detect CloudTrail's
CreateLogGroupAPI event → automatically invoke a Lambda → runput-retention-policy. Applied immediately at creation time. - Config Rule: The managed rule
cloudwatch-log-group-retention-period-check(parameterMinRetentionTime) detects non-compliance + a Remediation Action fixes it automatically. - CloudFormation / Terraform: Make
RetentionInDaysmandatory when defining a Log Group in IaC. However, Lambda creates it automatically on the function's first run, so it is missed unless you create it ahead of time with IaC.
Cost Structure: Four Items Where Operators Easily Blow Up
CloudWatch Logs cost consists of 4 items (Seoul ap-northeast-2 pricing).
| Item | Price | Meaning | Cost threat level |
|---|---|---|---|
| Ingestion | $0.76 per GB | Cost of receiving and storing logs | ★★★★★ (largest) |
| Storage | $0.033 per GB-month | Storage cost (3–7x more expensive than S3) | ★★★ |
| Insights Query | $0.0076 per GB scanned | Query execution cost | ★★ |
| Data Transfer | Standard rates | To other Regions or the internet | ★ |
Ingestion is overwhelmingly the largest. So "reducing log volume" is the No. 1 way to cut cost.
⚠️ Trap: Sending VPC Flow Logs to CloudWatch Logs makes Ingestion cost explode. A large VPC produces tens of GB to several TB per day on average. $10,000–$50,000 a month is common. Send VPC Flow Logs to S3 — that is the orthodox choice for both cost and analysis. Use CloudWatch Logs only for some patterns that need real-time alerts.
VPC Flow Logs Destination Comparison
| Destination | Ingestion cost | Storage cost | Analysis tool | When to use |
|---|---|---|---|---|
| CloudWatch Logs | $0.50 per GB | $0.03 per GB-month | Logs Insights | Real-time alerts |
| S3 | $0.50 per GB (collection) | $0.025 per GB-month | Athena | Long-term retention, bulk analysis |
| Kinesis Data Firehose | Firehose rates | Depends on destination | Splunk, OpenSearch | External SIEM |
The surface prices look similar, but for analysis, Logs Insights is $0.0076 per GB scanned, while Athena is $5/TB (that is, $0.005 per GB). For bulk analysis, Athena is overwhelmingly cheaper.
Log Subscription Filter: A Real-Time Log Processing Pipeline
A Subscription delivers a Log Group's new logs to another service in real time. Four targets operators often use.
| Target | When to use |
|---|---|
| Lambda | Log pattern match → automatic alerts, automatic recovery |
| Kinesis Data Streams | Real-time fan-out to other systems, multiple consumers |
| Kinesis Data Firehose | Batch loading to S3 / Redshift / OpenSearch |
| OpenSearch Service | Search and dashboards (formerly ElasticSearch) |
[Log Group]
    │ (real-time streaming)
    ▼
[Subscription Filter] ← filter by a pattern like "ERROR"
    │
    ├─→ Lambda     ← Slack/PagerDuty alerts, EC2 auto restart
    ├─→ Kinesis DS ← External SIEM such as Splunk/Datadog
    ├─→ Firehose   ← Long-term storage in S3
    └─→ OpenSearch ← Kibana dashboards
Subscription Filter Pattern Examples
"ERROR"                              # Word match
"[ip, user_id, status=5*, ...]"      # Space-delimited field match (5xx only)
{ $.statusCode = 5* }                # JSON path match
{ $.level = "ERROR" && $.latency > 1000 }  # AND condition
{ ($.statusCode = 5*) || ($.statusCode = 4*) }  # OR condition
A Subscription Filter is push-based, so latency is a few seconds. However, a Log Group can have at most 2 Subscription Filters (since 2023). If you need more, use a fan-out structure: send once to Kinesis Data Streams and have multiple consumers read from it. Another trap: a Subscription Filter applies only to newly arriving logs (forward-only). To process past logs retroactively, you need a separate export task.
As a hypothetical case, a company built an automation where, when the "Out of Memory: Kill process" pattern is detected in EC2's syslog, a Lambda automatically restarts the instance and sends a Slack alert to the operator. Average downtime dropped from minutes to seconds. In addition, the same Lambda published the alarm occurrence count as a metric, automatically identifying instance types where OOM repeats → replacing them with a larger-memory type in the next deployment, creating a closed-loop operations automation.
Cross-Account Subscription
To receive another account's Log Group into your own account's Kinesis, create a Log Destination resource and set up a cross-account IAM Trust.
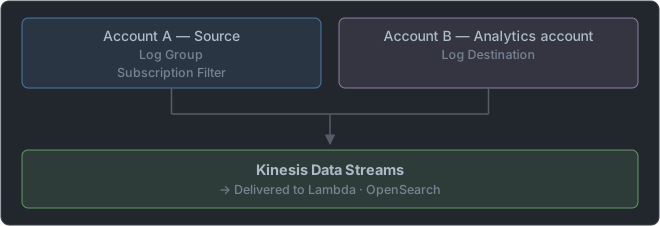
You must attach a Resource Policy that allows logs:PutSubscriptionFilter for Account B to the Destination. This pattern is the answer to the exam's "analyze logs from multiple accounts in real time in a central security account" scenario.
The Difference Between CloudWatch Logs and EventBridge
Two tools operators often confuse.
| Tool | What it processes | When to use |
|---|---|---|
| CloudWatch Logs Subscription Filter | Log message (text) patterns | ERROR in application logs, etc. |
| EventBridge (CloudWatch Events) | AWS API call events (CloudTrail-based) or custom events | Structured events such as "S3 object created," "EC2 state change" |
| CloudWatch Alarm | Metric threshold breach | Threshold-based such as "CPU above 80%" |
"Run a Lambda when an S3 object is created" is S3 Event Notification or EventBridge. "Alert when ERROR appears in Lambda logs" is a Logs Subscription Filter or Metric Filter → Alarm. "EC2 CPU above 80%" is a CloudWatch Alarm. You need clear boundaries among the three so you don't get confused on the exam.
Logs Insights: The Operator's SQL
CloudWatch Logs Insights searches and aggregates logs with a SQL-like query language. Here is a preview of a few patterns operators use daily.
-- 1) Top 100 ERROR logs in the last 10 minutes
fields @timestamp, @message, @logStream
| filter @message like /ERROR/
| sort @timestamp desc
| limit 100

-- 2) Average/max/p99 Duration per Lambda function
filter @type = "REPORT"
| stats avg(@duration), max(@duration), pct(@duration, 99) by bin(5m)

-- 3) Top URLs with 5xx responses from ALB access logs
parse @message "* * * * * * * * * * \"* * HTTP*\" * *"
  as time, elb, client, target, req_proc, target_proc, resp_proc,
     elbStatus, targetStatus, recvBytes, sentBytes, method, url, ver, ua, sslCipher
| filter elbStatus >= 500
| stats count() as errors by url
| sort errors desc
| limit 20

-- 4) Top user_id by request count (per-user analysis)
fields @message
| filter @message like /user_id/
| parse @message "user_id=*" as userId
| stats count(*) as requests by userId
| sort requests desc
| limit 50

-- 5) REJECT traffic in VPC Flow Logs
fields @message
| parse @message "* * * * * * * * * * * * * *"
  as ver, accId, eni, src, dst, srcPort, dstPort,
     proto, packets, bytes, start, end, action, logStatus
| filter action = "REJECT"
| stats sum(bytes) as totalBytes by src, dst
| sort totalBytes desc
| limit 30
Internally, Logs Insights distributes a query in parallel across multiple workers. Depending on Log Group size, tens to hundreds of workers each scan some Log Streams and merge the results (MapReduce pattern). That is why a query finishes in 10–30 seconds even on terabytes of logs. However, cost is billed by GB scanned ($0.0076 per GB), so these 3 principles are the key:
- Put
filteras early as possible: filtering during the scan rather than after it - Start with a narrow time range: narrowing from 1 week to 1 hour cuts cost to 1/168
- Specify
fieldsexplicitly: don't load unnecessary fields
It is in the same family as the distributed processing paradigm of MapReduce (Dean & Ghemawat, 2004 OSDI). A query = multiple mappers produce partial results → a reducer merges them. Apache Spark, Presto, and BigQuery have the same structure. The limit of Logs Insights is that logs are stored row-oriented (line), so column pruning is not possible. For bulk analysis, Athena (Parquet columnar storage) is overwhelmingly faster and cheaper.
If you set the time range to "1 week," it scans all logs for a whole week. That is a loss on both cost and speed. Operators always start with the narrowest possible time range and widen it gradually. In the order 1 hour → 6 hours → 24 hours.
VPC Flow Logs and Logs Integration Patterns
To analyze VPC traffic logs in real time, you choose between CloudWatch Logs and S3. The operator's decision tree.
                  VPC Flow Logs
                       │
        ┌──────────────┴───────────────┐
        │                              │
   "Real-time alerts needed"     "Long-term retention / bulk analysis"
        │                              │
        ▼                              ▼
   CloudWatch Logs                    S3
        │                              │
        │ Logs Insights                │ Athena
        │ Subscription Filter         │ Glue Catalog
        │ Metric Filter → Alarm       │ Lake Formation
        ▼                              ▼
   Real-time debugging                 Ad-hoc bulk analysis
The S3 + Athena pattern is cost-efficient. A frequently used query in Athena:
-- Analyze REJECT traffic with S3 + Athena
SELECT srcaddr, dstaddr, dstport, SUM(bytes) AS total_bytes
FROM vpc_flow_logs
WHERE action = 'REJECT'
  AND date_partition = '2025-05-26'
GROUP BY srcaddr, dstaddr, dstport
ORDER BY total_bytes DESC
LIMIT 30;
With this one query, you can immediately see "which IP is being blocked by which IP." The standard for SG/NACL debugging.
Exporting Logs to S3: Two Methods
Two ways to send Logs to S3 for long-term storage and cost reduction.
1. Manual Export (CreateExportTask API)
aws logs create-export-task \
  --log-group-name /aws/lambda/my-function \
  --from 1716700000000 --to 1716800000000 \
  --destination my-logs-archive \
  --destination-prefix exports/my-function/
A one-off batch. Takes 5 minutes or more. Operators run it once a quarter or half-year in preparation for compliance audits.
2. Subscription Filter → Kinesis Firehose → S3 (Real-Time Streaming)
[Log Group]
    │ (Subscription Filter)
    ▼
[Kinesis Data Firehose]
    │ (buffering + compression + partitioning)
    ▼
[S3 with lifecycle: Standard → IA → Glacier Deep Archive]
The operator standard. Firehose handles buffering (usually 5 minutes or 5MB), compression (Gzip or Parquet), and partitioning (year=2025/month=05/day=26/) automatically. After sending to S3, run ad-hoc queries with Athena.
Cost comparison: CloudWatch Logs Storage ($0.033/GB) → S3 Standard ($0.025/GB) → S3 Glacier Deep Archive ($0.00099/GB), cutting cost down to 1/33.
As a hypothetical case, a financial company kept audit logs with a 7-year retention obligation in CloudWatch Logs and was paying $15,000 a month. After switching to a Subscription → Firehose → S3 Standard 1 year → Glacier Deep Archive 6 years lifecycle, the monthly cost was $400. A 38x reduction. It is the single largest change an operator can make to reduce retention cost.
Logs Anomaly Detection (Launched 2023)
Log Anomaly Detection, launched in December 2023, learns the log patterns themselves with ML and automatically detects abnormal patterns. If a metric's Anomaly Detection looks at "anomalies in numbers," this looks at "anomalies in log patterns."
[Normal learned patterns]
"INFO Started processing order=*"
"INFO Order * completed in *ms"
"WARN Retry attempt * for order *"

[Anomaly detection]
"FATAL Database connection lost"             ← Pattern seen for the first time, alarm
"INFO Started processing order=*"            ← Same pattern but 10x the usual frequency, alarm
ML learns the baseline automatically even if the operator doesn't create manual Metric Filters. However, learning takes at least several days to several weeks, so it cannot be applied immediately to a new workload.
CloudWatch Logs Cross-Account Observability (Launched 2022)
To view logs, metrics, and X-Ray from multiple accounts in one console, use the CloudWatch Observability Access Manager.
[Monitoring Account] ← The account the operations team looks at
   │ Sink enabled
   │
   ├── Metrics, logs, X-Ray from Source Account A synced automatically
   ├── Source Account B
   └── Source Account C
Operator pattern: create a separate Monitoring Account and connect sinks from all workload accounts. The operator views the metrics, logs, and X-Ray traces of all accounts in one console. There is also an option to automatically enroll the whole Organization.
Summary
The operator's checklist for CloudWatch Logs:
- Apply a retention policy to every Log Group: no Never Expire. No. 1 First-Day Action
- VPC Flow Logs go to S3: prevents CloudWatch cost explosion. Only those needing real-time alerts go to CloudWatch
- Real-time automation with Subscription Filters: ERROR pattern → Lambda → Slack/automatic recovery
- Logs Insights with a narrow time range and filter pushdown: cost and speed
- Long-term retention is S3 + Athena + Glacier lifecycle: cost down to 1/33
- Cross-Account is the Observability Access Manager: separate Monitoring Account pattern
Tomorrow we go deeper into the Logs Insights query language — building a library of troubleshooting patterns that operators use every day.
📝 Practice Questions
Click a choice to reveal the answer and explanation.
Question 1
You run 500 Lambda functions and CloudWatch Logs cost exploded. What is the most effective first action?
Question 2
An operator must send VPC Flow Logs in real time, and traffic averages 100GB per day. Where is it better to send them, in terms of both cost and analysis?
Question 3
You want to detect ERROR logs of a Lambda function in real time and send a Slack alert to the operator. What is the most efficient structure?
Question 4
A Logs Insights query with the time range set to 1 week caused cost and speed problems. What is the operator's standard response?
Question 5
An operator wants to automatically restart an instance when the "Out of Memory" pattern is detected in EC2's syslog. What is the most direct structure?
Question 6
You want to analyze ERROR logs from 50 accounts in real time in a central security account via Cross-Account. What is the most appropriate pattern?
Question 7
To minimize the cost of audit logs with a 7-year retention obligation?