Based on the MLA-C01 exam guideReport an error
MLA-C01· AssociateWeek 8 · Day 1~26 min read
Day 1 - SageMaker Model Monitor: Data Quality and Model Quality Drift
📌 Key Takeaways
- Drift is the phenomenon where the world at training time and the world in operation fall out of step. Left alone, model performance quietly collapses.
- Model Monitor offers four kinds: data quality, model quality, bias drift, and feature attribution drift (the last two are Day 2).
- All monitoring starts from Data Capture, which stores requests and responses in S3. If capture is off, there is no data to look at.
- The baseline (
statistics.json+constraints.json, built on Deequ internally) is the standard for "normal". A cron schedule launches a Processing Job each period to compare against it. - Data quality looks at the distribution of input X without labels; model quality merges in ground truth to see actual performance degradation.
The Monitoring Pipeline on One Page
The whole Model Monitor process boils down to the single flow below. Exam questions ask about one box in this picture.
   [Client]
        │ invoke_endpoint
        ▼
 ┌──────────────────┐
 │  Real-time endpoint │──▶ ① Data Capture (request/response JSON Lines)
 └──────────────────┘             │
        ▲                          ▼
        │                 s3://.../datacapture/
        │                          │
        │                          ▼
        │              ┌───────────────────────────┐
        │   ② Baseline  │  Processing Job (cron period) │ ◀── statistics.json
        │   (training data)│   captured data vs baseline   │ ◀── constraints.json
        │              └───────────────────────────┘
        │                          │
        │              ③ constraint_violations.json (violation report)
        │                          │
        │                          ▼
        │                 ④ CloudWatch metrics · alarms
        │                          │
└──── ⑥ Redeploy ◀── ⑤ Retraining trigger (EventBridge/Lambda→Pipelines)| Step | Output | Easy to miss |
|---|---|---|
| ① Data Capture | JSON Lines in S3 (inputs and outputs) | Must be turned on when the endpoint is deployed. If it is off, every later step spins idle |
| ② Baseline | statistics.json, constraints.json | When you retrain, the baseline must be rebuilt too |
| ③ Comparison run | constraint_violations.json | The executor is not the endpoint but a separate Processing Job |
| ④ Metrics and alarms | CloudWatch metrics | If enable_cloudwatch_metrics=True is off, you cannot set alarms |
| ⑤ Trigger | Pipeline execution | Violation detection itself does not retrain. You have to build the connection separately |
Comparing the Four Model Monitor Types
Model Monitor offers four types of monitors. Today covers the first two; the other two (bias and explainability) are covered on Day 2.
| Monitor type | What it watches | Ground truth labels needed? | Baseline output |
|---|---|---|---|
| Data Quality | Changes in the statistical distribution of input features | Not needed | Per-feature statistics + constraints (Deequ) |
| Model Quality | Degradation in prediction accuracy/performance metrics | Needed (ground truth) | Performance metrics on the validation set |
| Bias Drift | Changes in prediction bias between groups | Labels needed | Clarify bias metric reference values |
| Feature Attribution Drift | Changes in the distribution of feature importance | Not needed | SHAP reference importance |
Drift splits into two broad kinds. Data drift (covariate shift) is when the distribution of input features X changes, and concept drift is when the relationship between input and output, P(Y|X), itself changes. The data quality monitor catches changes in the distribution of X (data drift) without labels, while the model quality monitor catches actual performance degradation (the consequence of concept drift) by comparing against ground truth. This distinction is the heart of the "which monitor should you use" questions.
Data Capture - The Starting Point of Monitoring
All monitoring begins by storing the requests and responses going in and out of the endpoint in S3. This is called Data Capture. If you do not turn capture on, there is no data to watch.
from sagemaker.model_monitor import DataCaptureConfig

data_capture_config = DataCaptureConfig(
    enable_capture=True,
    sampling_percentage=100,            # what % of incoming requests to capture
    destination_s3_uri="s3://my-bucket/datacapture/",
)
# Pass this configuration along when deploying the endpoint
predictor = model.deploy(
    initial_instance_count=1,
    instance_type="ml.m5.xlarge",
    data_capture_config=data_capture_config,
)- With
sampling_percentage, you can sample only part of the traffic when volume is high, cutting storage cost. - Capture files accumulate split by hourly paths (endpoint/variant/year/month/day/hour). A scheduled run reads only the interval that matches its own period.
- The storage format is JSON Lines - one line is one request/response, containing both the input (endpointInput) and output (endpointOutput).
If an endpoint is already running, you can also update just the configuration without redeploying.
import boto3
sm = boto3.client("sagemaker")

# Path for turning on capture on an endpoint already in operation (change endpoint config → update)
sm.create_endpoint_config(
    EndpointConfigName="my-endpoint-config-v2",
    ProductionVariants=[...],
    DataCaptureConfig={
        "EnableCapture": True,
        "InitialSamplingPercentage": 100,
        "DestinationS3Uri": "s3://my-bucket/datacapture/",
        "CaptureOptions": [{"CaptureMode": "Input"}, {"CaptureMode": "Output"}],
    },
)
sm.update_endpoint(EndpointName="my-endpoint",
                   EndpointConfigName="my-endpoint-config-v2")
⚠️ Trap: In the scenario "I turned monitoring on but the run results stay empty", the number one cause is Data Capture not configured or the sampling percentage too low. The number two cause is that there was no traffic at all in that period. Before suspecting the baseline or the schedule, first check whether files are piling up at the capture S3 path.
Baseline - Building the Standard for "Normal"
To detect drift, you need a standard for "what is normal". Model Monitor analyzes the training data (or validation data) and automatically generates baseline statistics and constraints.
- statistics.json: Statistical summaries of each feature such as mean, standard deviation, min/max, and distribution
- constraints.json: Rules each feature must satisfy (e.g., not null, data type, value range)
Internally it uses Deequ (a data quality verification library built by Amazon).
from sagemaker.model_monitor import DefaultModelMonitor
from sagemaker.model_monitor.dataset_format import DatasetFormat

monitor = DefaultModelMonitor(role=role, instance_count=1, instance_type="ml.m5.xlarge")

# Generate baseline from training data → produces statistics.json, constraints.json
monitor.suggest_baseline(
    baseline_dataset="s3://my-bucket/train/train.csv",
    dataset_format=DatasetFormat.csv(header=True),
    output_s3_uri="s3://my-bucket/baseline/",
)
The baseline is not "make it once and done". If you retrained the model or deliberately changed the data distribution, you must regenerate the baseline too. Leaving a stale baseline in place either flags legitimate changes as drift (false positives) or, conversely, lets real drift slip by because you are measuring against the new standard. The baseline is a snapshot of "the state we currently believe is normal".
Monitoring Schedule - Comparing on a Regular Basis
Once the baseline is ready, you create a monitoring schedule. The schedule sets a period (usually hourly) with a cron expression, and each period SageMaker launches a Processing Job that compares recently captured data with the baseline.
from sagemaker.model_monitor import CronExpressionGenerator

monitor.create_monitoring_schedule(
    monitor_schedule_name="data-quality-schedule",
    endpoint_input=predictor.endpoint_name,
    output_s3_uri="s3://my-bucket/monitor-results/",
    statistics=monitor.baseline_statistics(),
    constraints=monitor.suggested_constraints(),
    schedule_cron_expression=CronExpressionGenerator.hourly(),  # runs every hour
    enable_cloudwatch_metrics=True,
)
When each run finishes, a violation report (constraint violations report) is generated in S3. If there are violations, it records which feature broke which rule. Also, with enable_cloudwatch_metrics=True, result metrics are sent to CloudWatch so you can set alarms (the Day 3 topic).
Check the run history and whether there were violations directly with the SDK/boto3.
# Recent schedule executions - a status of CompletedWithViolations means there were violations
execs = monitor.list_executions()
last = execs[-1].describe()
print(last["ProcessingJobStatus"])
print(last["ProcessingOutputConfig"])   # S3 path where the violation report landed
The typical violation types seen in captured data are below. Which name appears is itself a hint to the cause.
| Violation type | Meaning | Common real-world cause |
|---|---|---|
data_type_check | A value of a different type than expected arrived | Strings or empty strings flowing into a numeric column |
completeness_check | Missing-value ratio exceeds the threshold | Upstream join failure, optional input fields |
baseline_drift_check | Distribution moved away from the baseline | Genuine data drift, seasonality |
missing_column_check / extra_column_check | A column went missing or was added | Preprocessing code change, schema change |
categorical_values_check | A category value that did not exist at training appeared | New product codes or region codes added |
A violation does not mean retraining is immediately the answer. missing_column_check or data_type_check are likely data pipeline bugs, and retraining the model does not fix those. Conversely, when baseline_drift_check keeps firing on several features, that is the time to consider retraining. First separate "is it a schema problem or a distribution problem".
Model Quality Monitor - Ground Truth Is Required
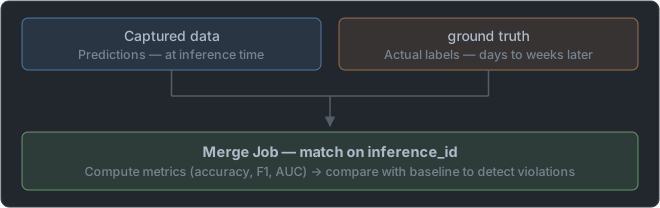
The data quality monitor only needs to see the inputs, but the model quality monitor must know whether the model got it right or wrong. That means collecting the actual answer (ground truth label) later and pairing it with the prediction.
The flow goes like this.
- The endpoint produces a prediction and Data Capture stores it.
- As time passes and the actual outcome (the answer) is confirmed, you upload it to S3 so that it matches by
inference_id. - The model quality monitor merges the predictions and the answers and computes performance metrics such as accuracy, F1, and AUC.
- If degradation relative to the baseline performance exceeds the threshold, it is flagged as a violation.
from sagemaker.model_monitor import ModelQualityMonitor

mq_monitor = ModelQualityMonitor(role=role, instance_count=1, instance_type="ml.m5.xlarge")
mq_monitor.suggest_baseline(
    baseline_dataset="s3://my-bucket/validation-with-labels.csv",
    dataset_format=DatasetFormat.csv(header=True),
    problem_type="BinaryClassification",
    inference_attribute="prediction",      # prediction column
    ground_truth_attribute="label",        # ground truth column
    output_s3_uri="s3://my-bucket/mq-baseline/",
)
Choose problem_type to match the problem type - BinaryClassification, MulticlassClassification, Regression. The set of metrics computed depends on the type (classification uses accuracy/F1/AUC-family metrics, regression uses error-family metrics).
| Category | Data quality monitor | Model quality monitor |
|---|---|---|
| What it looks at | Distribution and schema of input X | Whether predictions were actually right |
| Ground truth | Not needed | Required |
| Detection timing | Immediate (next period) | Delayed until answers accumulate |
| What it catches | Data drift, pipeline incidents | The consequence of concept drift (performance degradation) |
| Limitation | Performance can be fine even when the distribution changes | You only know after the damage is already done |
⚠️ Trap: "Monitor whether model accuracy is actually dropping" refers to the model quality monitor, not data quality. And the model quality monitor absolutely requires ground truth. If the exam asks "how do you detect performance degradation in advance when you cannot collect ground truth labels?", model quality is impossible, so you work around it with data quality drift (input distribution change) or feature attribution drift.
When Monitoring Gets Tangled: Symptom → Cause → Action
| Symptom | Common cause | Action |
|---|---|---|
| The schedule runs but results stay empty | Data Capture not configured, sampling rate too low, zero traffic in that period | Check the capture S3 path → raise enable_capture / sampling_percentage |
| The model quality monitor cannot produce metrics | Ground truth not collected, or merge failed because inference_id did not match | Check the answer upload path and ID matching rules. If there are no answers at all, substitute data quality/feature attribution |
| Violations pour in right after deployment | Preprocessing mismatch - training used scaling, inference used raw values | Unify the training and inference preprocessing code (pipeline model, same script) |
| Drift alerts although nothing changed | Stale baseline (forgot to update after retraining), seasonality | Regenerate the baseline, readjust thresholds and evaluation period |
| Drift alert but model quality is normal | A feature with no effect on performance changed | Observe rather than retrain immediately. Apply tiered thresholds, focusing on important features |
| Cannot set alarms on violation metrics | enable_cloudwatch_metrics is off | Recreate the schedule with the metric publishing option |
| Monitoring costs more than expected | Hourly Processing Job + 100% capture | Lengthen the period and lower sampling_percentage |
In the next post, we look at monitoring the remaining two monitors, bias drift and feature attribution drift, with SageMaker Clarify.
📖 Glossary
- Drift: The phenomenon where the data and relationships at training time diverge from those in operation. The cause of performance slowly collapsing.
- Data drift / concept drift: The distribution of input X changing / the relationship P(Y|X) between input and answer itself changing.
- Data Capture: A feature that stores an endpoint's requests and responses in S3 as JSON Lines. The raw material for all monitoring.
- Baseline: A snapshot of the standard for "normal". It comes out as two files,
statistics.json(statistics) andconstraints.json(rules). - Deequ: A data quality verification library built by Amazon. The engine that computes the data quality baseline in Model Monitor.
- Monitoring schedule: A reservation that launches a Processing Job every cron period to compare captured data against the baseline.
- Processing Job: A separate compute task that actually performs the comparison and analysis. The endpoint does not compute it directly.
- Constraint violations report: A result file recording which feature broke which rule. The violation type name is itself a hint to the cause.
- Ground truth: The actual answer used to judge whether a prediction was right. Needed only by the model quality monitor and usually confirmed late.
- inference_id: An identifier that pairs one prediction with the answer that arrives later. If it does not line up, the merge fails.
📝 Practice Questions
Click a choice to reveal the answer and explanation.
Question 1
A team wants to monitor whether the distribution of input features arriving at a real-time endpoint differs from the training data. However, in production the actual ground truth labels for predictions cannot be obtained immediately. What is the appropriate type of Model Monitor?
Question 2
To detect drift with SageMaker Model Monitor, what must you prepare first?
Question 3
What fundamentally differs between the Model Quality monitor and the Data Quality monitor?
Question 4
If you set the monitoring schedule to hourly, what does SageMaker do at each interval?
Question 5
Which data quality verification tool does Model Monitor use internally to automatically compute baseline statistics and constraints?